03. Scripting Your Analysis
Scripting Your Analysis
Being able to write and run scripts is invaluable for programming tasks and projects.
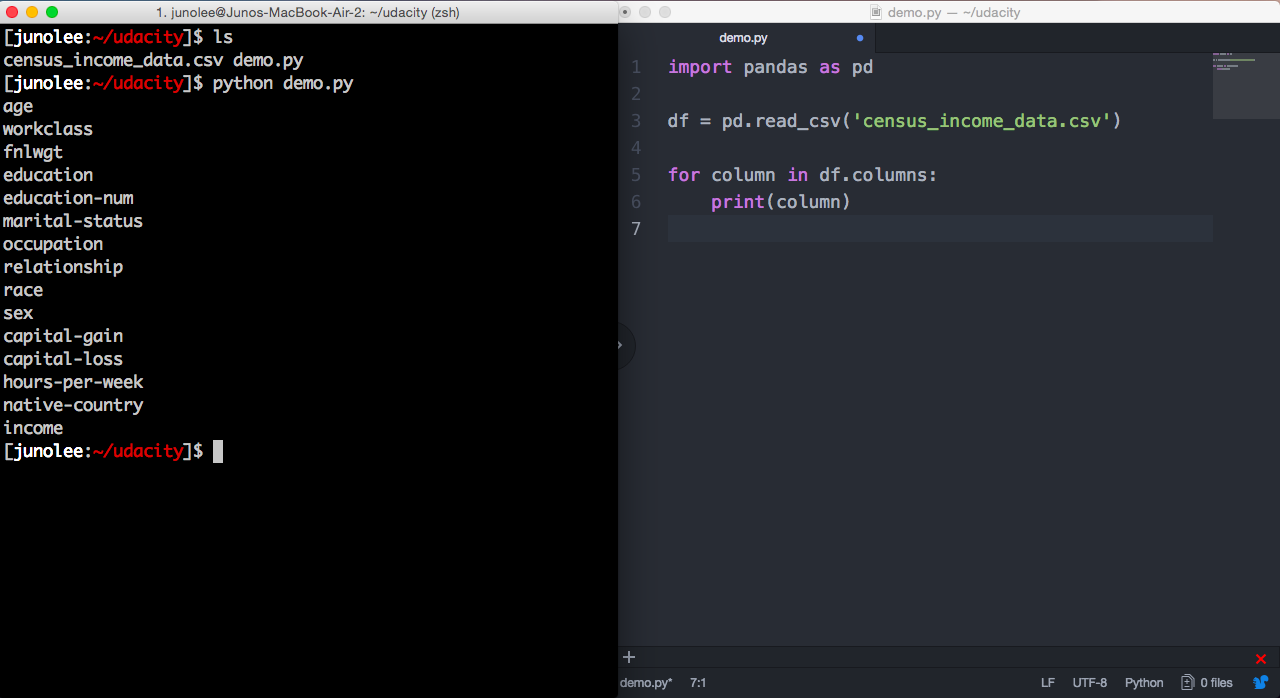
You can write your code in a text editor and then run the file in your terminal. Here's a simple example printing column names from the census income dataset. if you save your file as a .py file with the code shown on the right, you can run it as shown on the left. Make sure you are in the same directory you saved this file in!
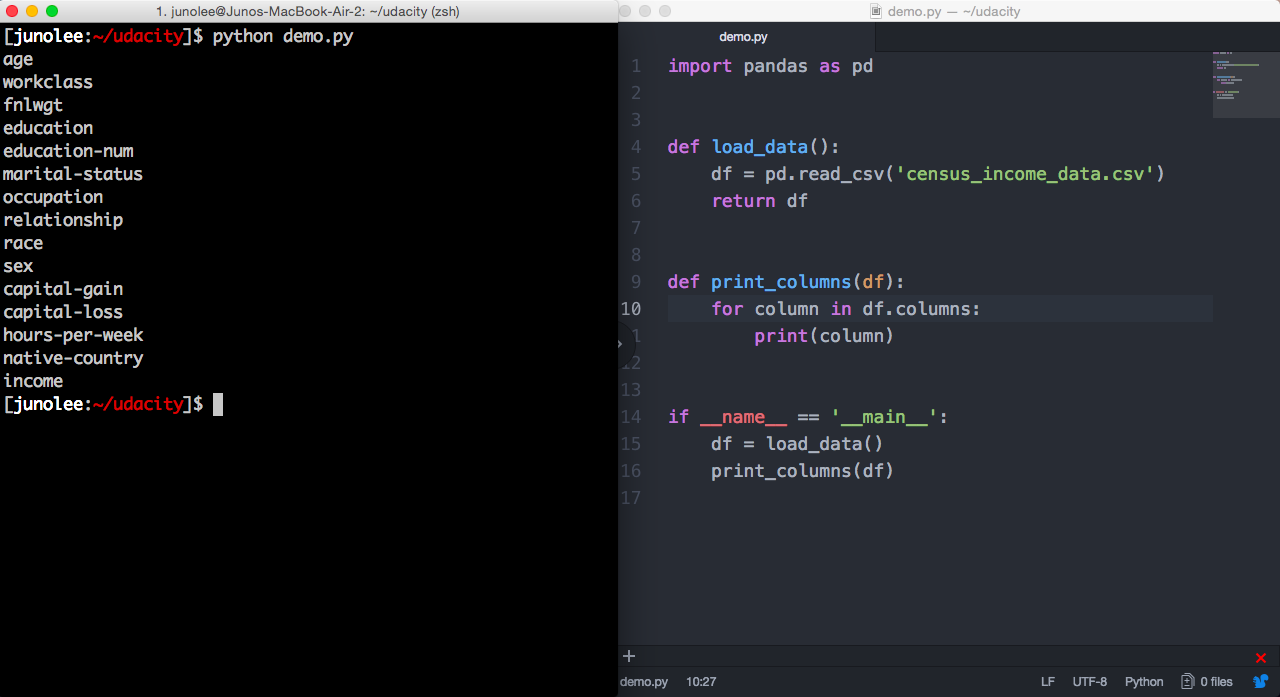
Ideally, you'd group your analysis into functions and run them in your main function. This helps you organize your code and generalize if possible.
The script below creates a double histogram of ages for people with lower and higher incomes.
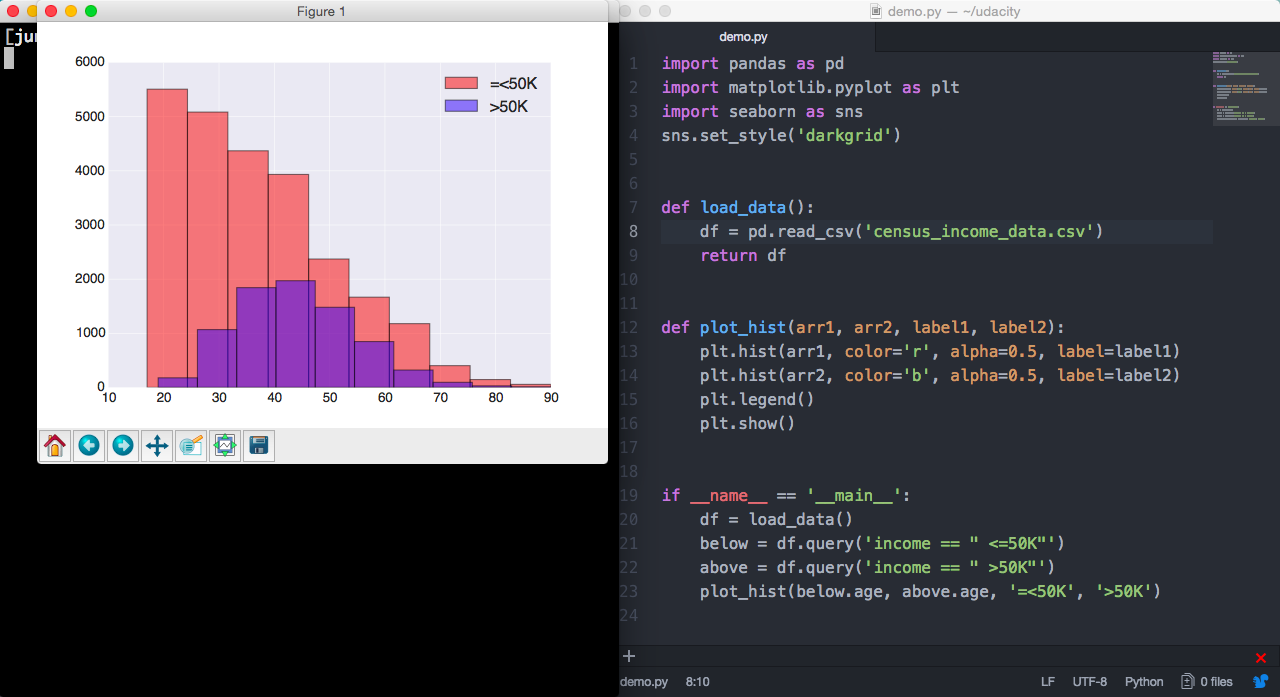
You can imagine how
plot_hist
could be reused if we had more double histograms. This function could even be more generalized. If we were creating a script for many visualizations for this dataset, the query logic we have in the main function should probably move to a different function. If this project got really big, we could even separate our code into different files or modules to make it even more organized.
These were just simple examples to expose you to a different workflow. Writing and running scripts from your terminal is a very flexible and powerful way to program. This is more ideal as a development environment than Jupyter Notebook - which still works and is very useful, but more suited for things like reports.
I strongly recommend getting familiar with a good text editor and using the terminal if you aren't already. Then, you could do things like automating scripts to pull data from a database every morning to deliver daily insights! Even if you don't do anything fancy like that, it will still be very valuable to be familiar with a good text editor and terminal.